About me.
BS-MS Earth and Planetary Sciences
I typically go by Nagraj.I'm Rayagada-bred (south Odisha, India). I'm currently pursuing BS-MS Dual Degree from IISER Kolkata. My research focus on Seiosmology and Geo dynamics. Currently I am working with Dr. Kajaljyoti Borah in Tomography Lab.
.MS Thesis
BS-MS Earth and Planetary Sciences
Estimation of Seismic b-value in North-East India.
Work
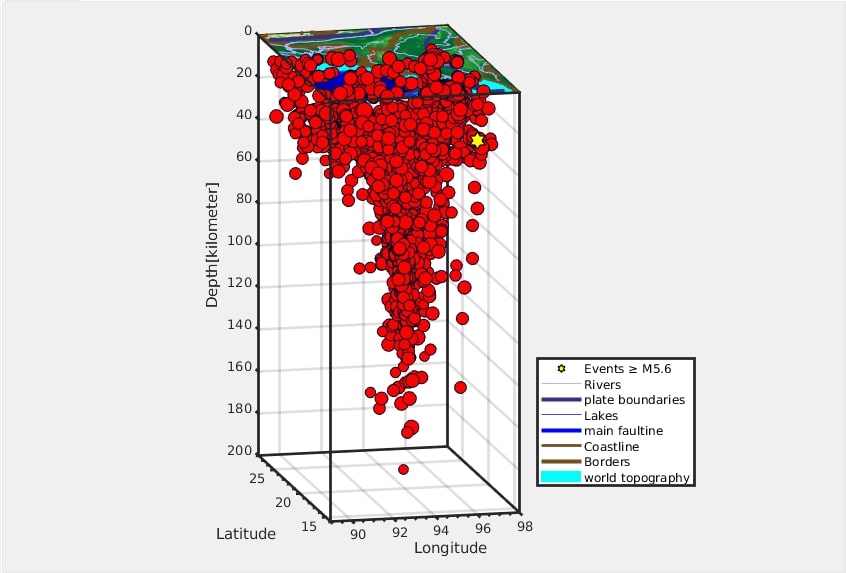
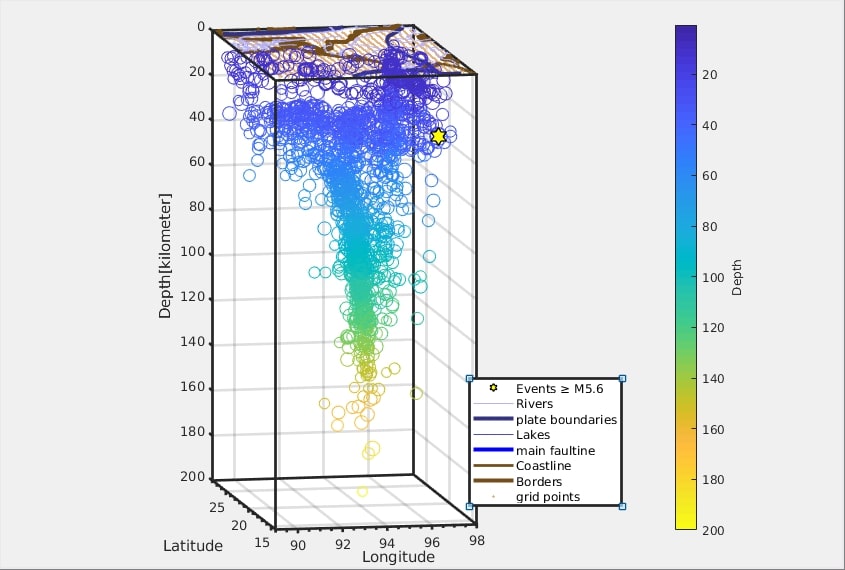
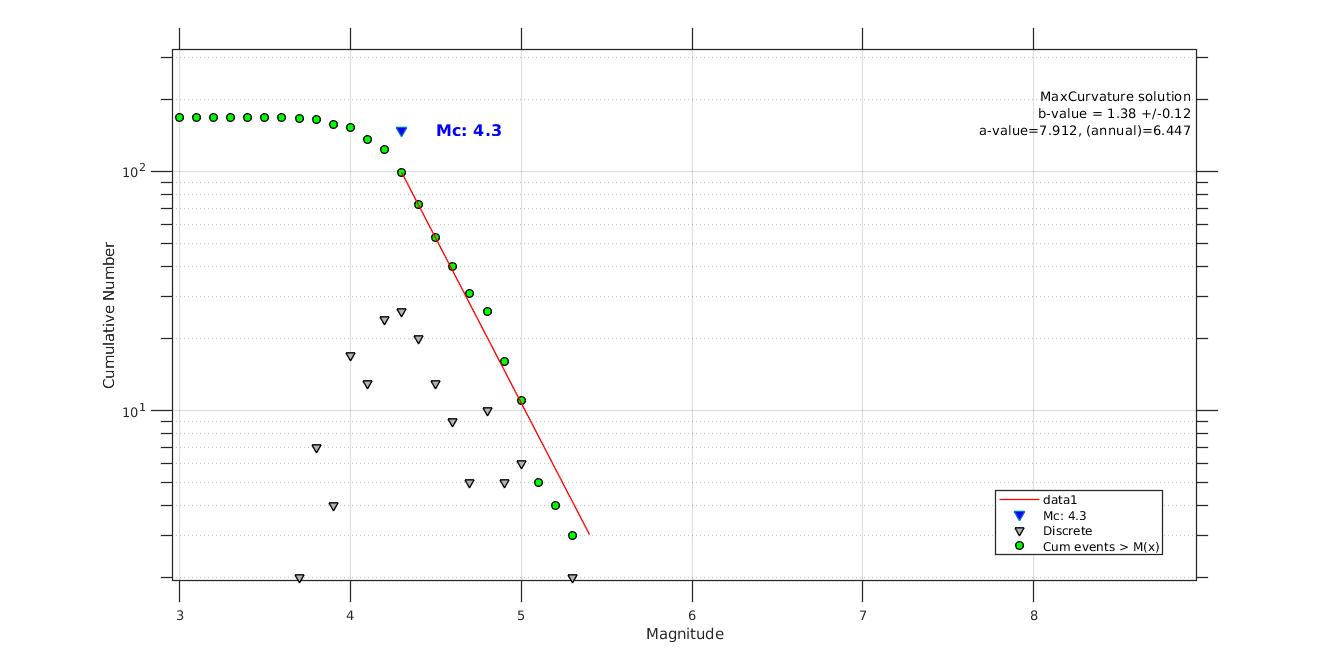
Everyday there are about fifty earthquakes worldwide, that are strong enough to be felt locally, and every few days an earthquake occurs that is capable of damaging structures.Studying of stress and seismicity of a region is necessary to study an Earthquake. North-East India is one of the most Earthquake-prone areas with Seismicity V in India. The primary factor to study an earthquake is the “b-value”. It gives us a clear intensity with which an earthquake occurs. It helps us to study the stress regime and seismicity of a given window. The Indian plate subducts under the Eurasian plate at 35mm/yr. The earthquake catalog data is obtained from 1990-2019 from United States Geological Survey (USGS) database. Body wave (mb) magnitude is used in this study. To study this region, we have divided this area into 1◦x1◦ geographical window grid boxes. We tried to see the variations in each grid boxes from West to East. It is found that along the subduction zone the b-value is approximately 1. However, for more clear studies, we divided the subduction with 10km window with respect to depth, to check how it varies with depth. The Earthquakes are found till 200km depth. A huge number of earthquakes occurred at a depth 50-80km. Every region plays an important role in earthquakes, may be the homogeneity, the soil structure, and the stress regime. So we divided this region into zones again but with respect to states. In each zone the b-value was different it is due to the station recording the events or significantly fewer data. If the b-value is higher, the smaller fraction of earthquakes happen in large magnitude, and if the b-value is lower, the larger fraction of earthquakes happen in smaller magnitude. Maximum Likelohood Method has been used to estimate the b-values in this study.