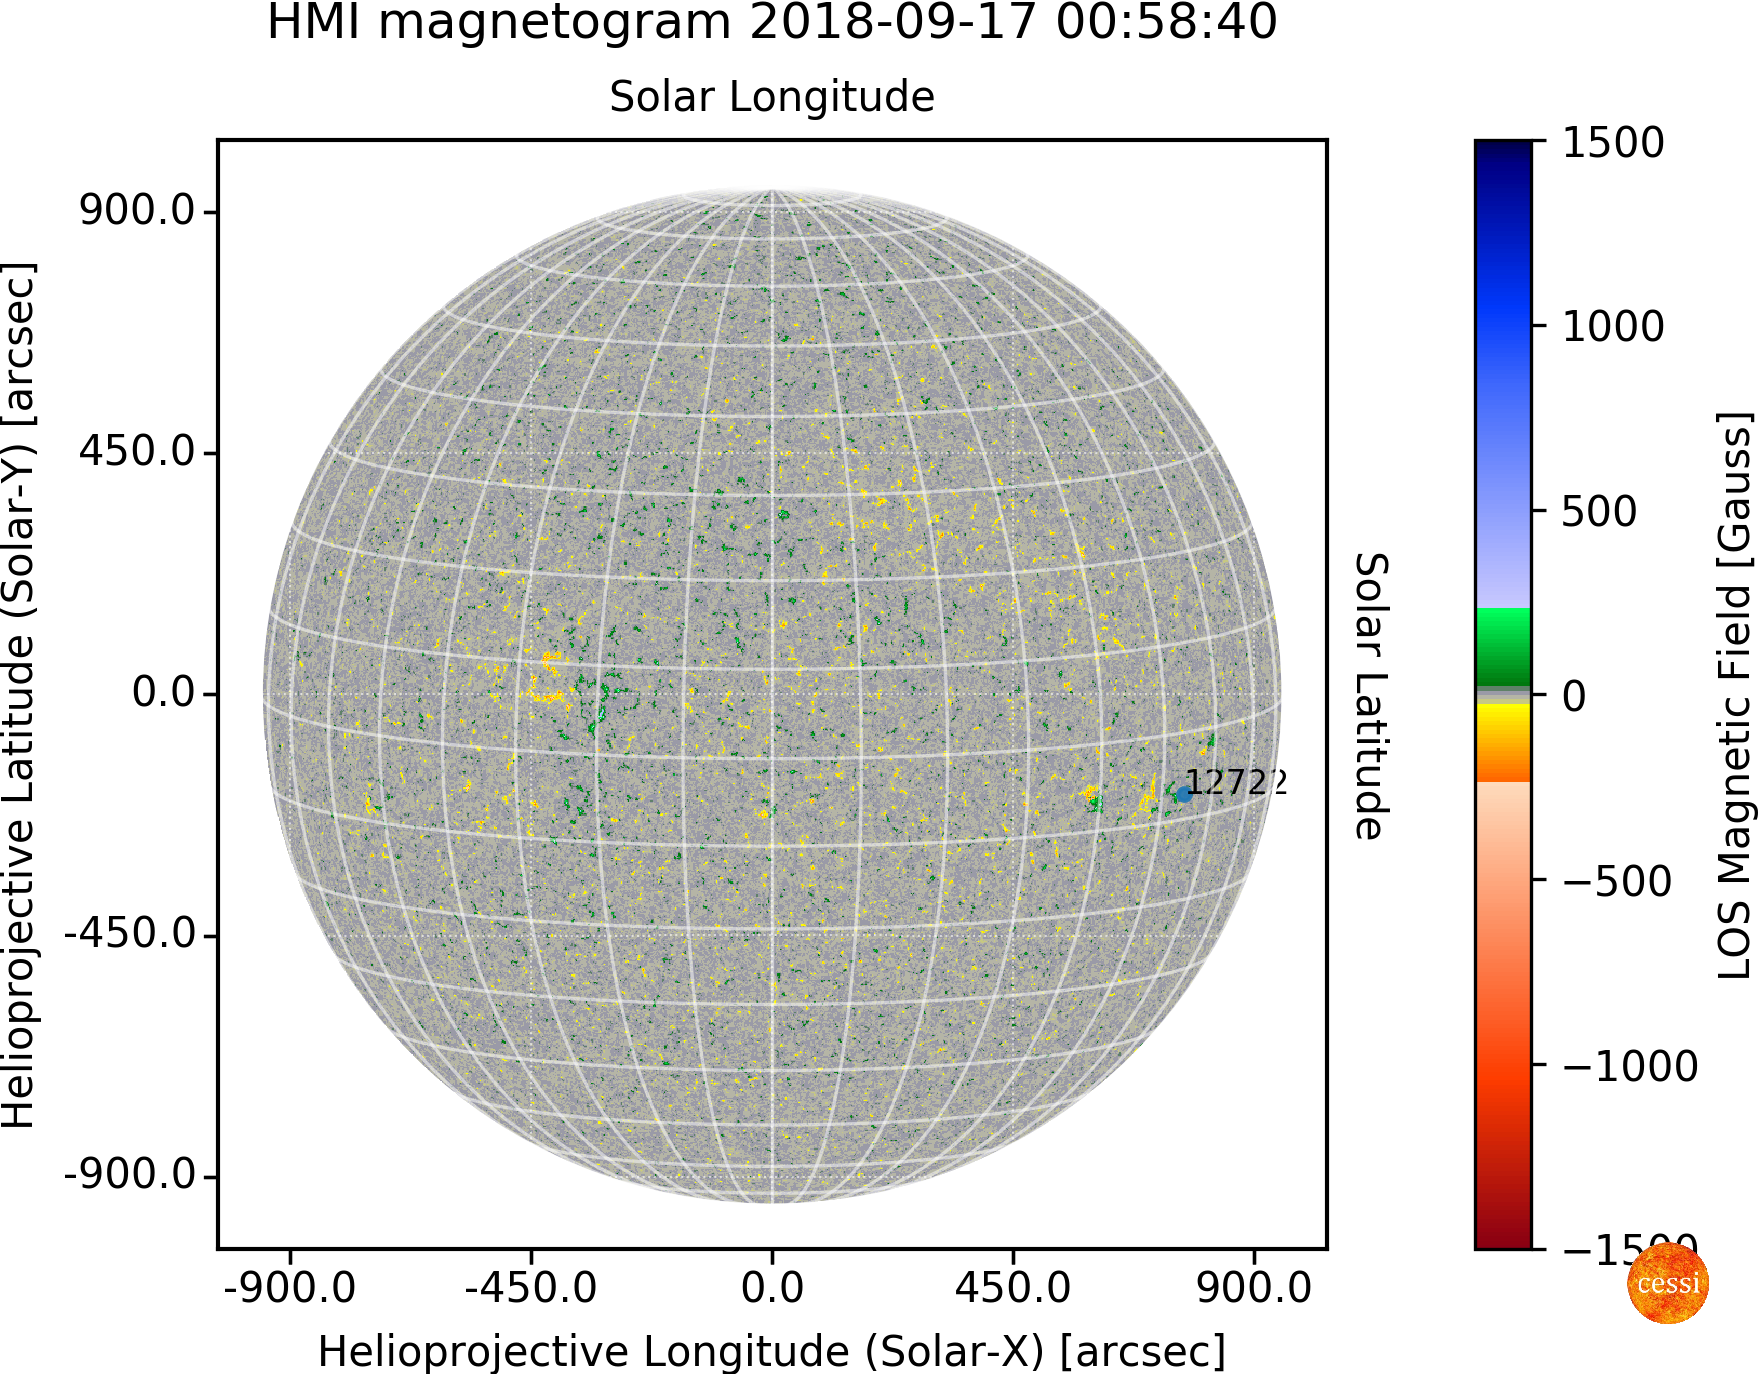
Above image is a Magnetogram which shows the Line of Sight (LOS) magnetic field distribution on the solar surface (Photosphere). The color table shows the polarity of magnetic field on Photosphere. The active regions recognized by NOAA is also over plotted and corresponding numbers are marked. The data for the construction of this image is provided by HMI . Plotting of the data is done using SunPy 0.8.2 .